Databricks SQL — Querying, Automation & Insights
Modern Story way — Easy to Understand
Imagine you’re a financial analyst at a major bank, and Databricks SQL is your analytical command center.
You sit on top of a vault full of data — from customer transactions, loan details, credit scores, to insurance claims.
Your SQL Editor is like your digital audit tool — helping you track, trace, and uncover insights such as:
💳 "Which credit card segment is seeing rising defaults?"
🏦 "Which branches are underperforming in loan disbursals?"
📉 "Where is revenue leaking in our investment portfolios?"
Once you craft a strong query, you can:
🗂️ Save it — like tagging important reports in your compliance binder.
⏰ Schedule it — so it runs every day/week/month — just like automated risk checks or daily NAV calculations.
📈 Feed dashboards — where your team, leadership, or regulators can see real-time trends at a glance.
So even before the market opens 📉📈, your automated queries have already delivered key insights — helping your team mitigate risks, seize opportunities, and stay compliant.
What is Databricks SQL?
Databricks SQL is a dedicated environment within the Databricks platform that allows users to run SQL queries on large datasets, build dashboards, and automate reporting — all through a web-based interface.
It’s built for analysts, business users, and data teams who work primarily with SQL and need powerful, scalable analytics.
Where to Access It
Login to Databricks Workspace
From the sidebar, click on “SQL” or “SQL Editor”.
This takes you into the Databricks SQL environment — designed specifically for SQL users.
✅ Note: If you're in the “Data Science & Engineering” view, switch to “SQL” from the left sidebar or top menu for a focused SQL experience.
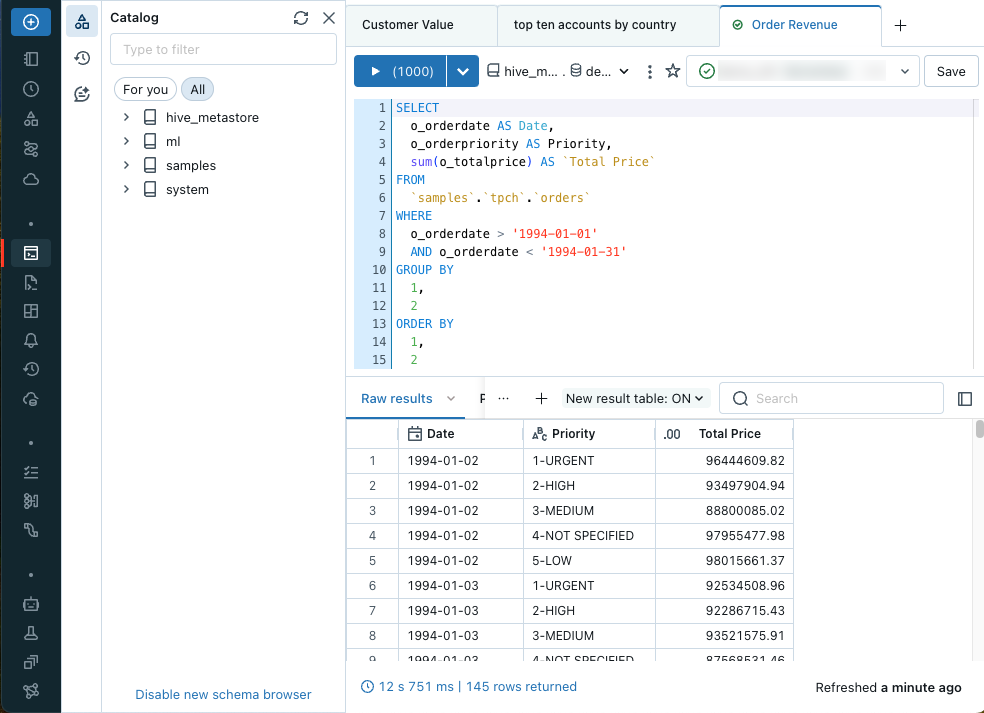
✍️ SQL Editor: Your Query Playground
The SQL Editor is the main interface where you:
- Write SQL queries using familiar syntax
- Explore schemas and tables on the left-side schema browser
- Run queries and see results instantly
Key Features:
- Autocomplete and syntax highlighting (helps you write faster and with fewer errors)
- Query history (easily revisit past queries)
- Multiple tabs (work on different queries in parallel)
- Save queries for reuse
🔍 Example: Want to see top-performing products last quarter? Write a query in SQL Editor, run it, and instantly view the results.
⏰ Scheduling Queries (Automation Made Simple)
After writing a useful query, you don’t need to run it manually every time.
You can schedule it to run automatically — daily, weekly, hourly, etc.
How to Schedule:
-
In the SQL Editor, click the "Schedule" button (usually at the top of the query editor).
-
Choose:
- How often it should run (daily, weekly, etc.)
- What time it should run
- Where to send the results: -📧 Email (send results to yourself or your team) -📊 Refresh a dashboard -💾 Save to a table or trigger an alert
When is Scheduling Useful?
This is perfect for reports or checks you need again and again — like:
- 📆 Daily sales summary
- 📉 Weekly customer churn report
- ⚠️ Monthly risk exposure check
✅ Why it helps:
Set it once, and Databricks will do the work for you — saving time and keeping your data always up to date.
📊 Visualizing Results: From Data to Insight
Once you run a SQL query in Databricks, you don’t just see numbers — you can turn those results into charts with a few clicks.
You can create:
📊 Bar charts – Great for comparing things (e.g., sales by region)
📈 Line graphs – Perfect for trends over time (e.g., daily revenue)
🥧 Pie charts – Useful to show parts of a whole (e.g., market share)
🗺️ Maps – See data by location (e.g., claims by city)
📌 After making a chart, you can "pin" it to a dashboard — like a report board that updates automatically whenever new data comes in.
This means:
-No more manual updates
-Easy sharing with your team or managers
-Instant visibility into key metrics
🧩 Integrations & Advanced Use Cases
Databricks SQL works well with other tools so you can do more than just run queries. Here’s how:
🔁 Databricks Jobs
Think of this like setting up a chain reaction. You can run multiple queries in a specific order — for example:
First clean the data → then analyze → then save the result — all on a schedule.
It’s great when your analysis has many steps.
🚨 Alerts
You can set up rules to watch your data, like:
“If fraud cases go over 100 today, send me an alert.”
This helps catch problems early — without you checking manually.
📊 BI Tool Integration
Already using tools like Power BI, Tableau, or Looker to make dashboards?
You can connect them directly to Databricks SQL, so they pull data automatically and always show the latest insights.
🧠 In Summary: What Your Users Can Do in Databricks SQL
| Task | Where & How |
|---|---|
| Run queries | Go to SQL Editor → Write & Run SQL |
| Explore data | Use schema browser in SQL Editor |
| Save queries | Click "Save" in SQL Editor |
| Schedule reports | Click "Schedule" → Set time/frequency |
| Create dashboards | Pin visualizations to dashboards |
| Share results | Share dashboards or schedule email reports |
| Set alerts | Create conditional alerts on query results |
🎯 Example User Journey: From Query to Dashboard
-
Go to SQL Editor
-
Write:
SELECT branch_name, SUM(loan_amount)
FROM loans
WHERE issued_date >= '2023-01-01'
GROUP BY branch_name
ORDER BY SUM(loan_amount) DESC;
-
Run the query
-
Click on “+ Visualization” → Choose Bar chart
-
Save & pin to a Dashboard (e.g., “Quarterly Loan Performance”)
-
Click “Schedule” → Run every Monday at 8 AM
-
Share the dashboard link with leadership — they get live updates every week
✅ Simple Visual Walkthrough of Databricks SQL for Beginners
🟦 1. Home Screen → Go to SQL Editor
-This is where you start writing SQL queries.
-Access it from the left sidebar: Click on "SQL" or "SQL Editor".
🟦 2. SQL Editor Interface (Your Query Playground)
-✅ Write your SQL query in the main window.
-🧭 Use the left panel to browse your tables (Schema Explorer).
-▶️ Click “Run” to see results below.
🟦 3. Saving and Scheduling a Query
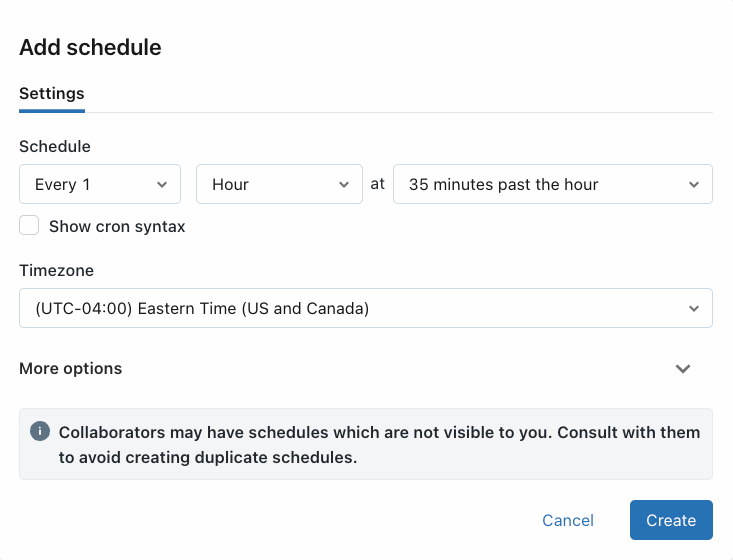
-🗂️ After writing a useful query, click “Schedule” to automate it.
-⏰ Choose how often it should run (daily, weekly, etc.) and where results go (dashboard, email).
🟦 4. Visualize Query Results
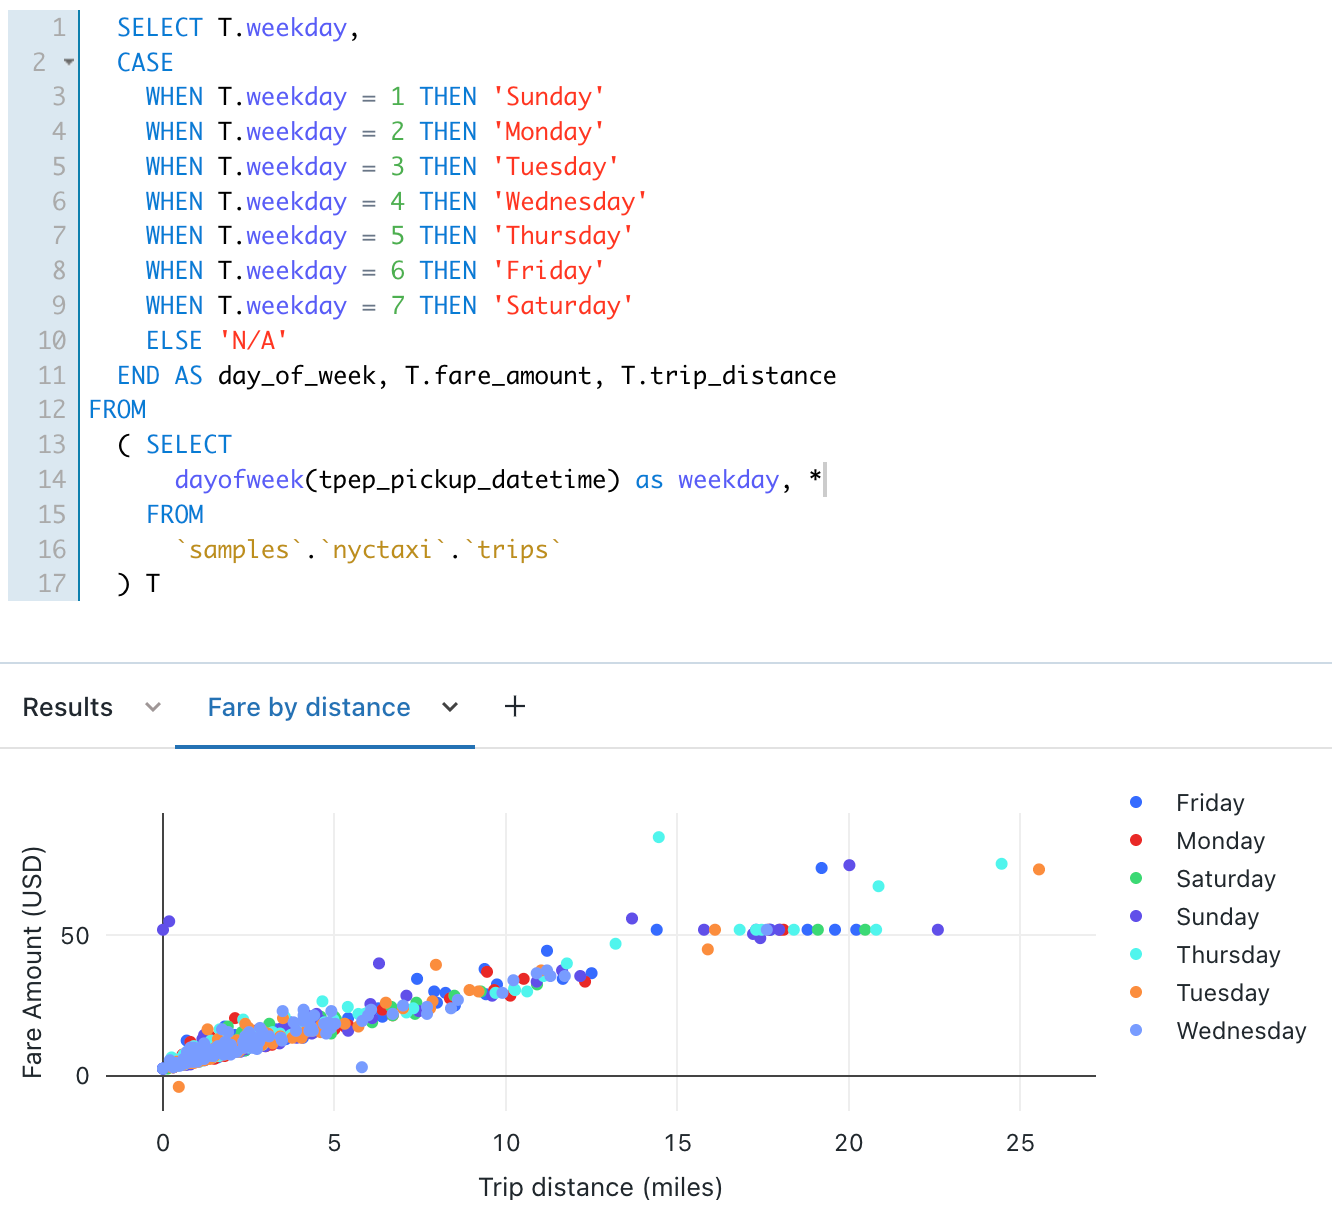
-📊 Once you run a query, click “+ Visualization”.
-Choose chart type (bar, line, pie, map).
-Customize labels and colors.
🟦 5. Pin to Dashboard (Build a Report)
-📌 Click “Pin to Dashboard” to add your chart to a live dashboard.
-You can create filters, arrange charts, and share the dashboard with your team.
🔑 1-Minute Summary — Databricks SQL & Dashboards
| Feature / Step | What it Does |
|---|---|
SQL Editor | Write, run, and test SQL queries with autocomplete and schema browser |
Save Query | Stores your query for future reuse |
Schedule Query | Automate query runs daily/weekly/monthly + send results via email/dashboard |
+ Visualization | Turns query results into charts (bar, line, pie, map) |
Pin to Dashboard | Adds visuals to a live dashboard you can share and auto-refresh |
Alerts | Set rules (e.g., notify if fraud count > 100) |
Databricks Jobs | Run complex pipelines or multiple queries together |
BI Tool Integration | Connect Power BI, Tableau, etc. via ODBC/JDBC |
Example: | SELECT branch_name, SUM(loan_amount) ... → bar chart → dashboard → share |